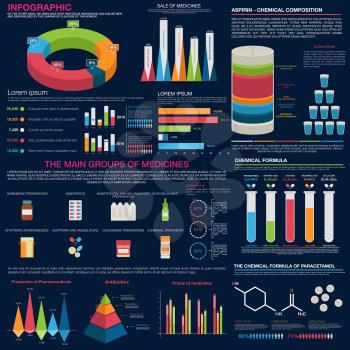
Sales and production infographic of main groups of medicines, pie charts and pyramid diagrams of pricing by years, chemical formulas and compositions of aspirin and paracetamol. Use as pharmaceutical
 https://iphotos.com/termsofuse.php
https://store.clipart.com/index.php?ref=iphotoscom&iid=1407184&tl=clipart&accept=ppd
https://iphotos.com/termsofuse.php
https://store.clipart.com/index.php?ref=iphotoscom&iid=1407184&tl=clipart&accept=ppd
Subscribe today for one low price and download images as and when you need them with no additional fees. Compare subscriptions.Only need one image? Purchase it individually from as little as $7.95:
Not sure what file format to choose? Please visit our FAQ.
Compare our different licensing options.
Available file format(s): AI [1,388.8 Kb] EPS [6,062.5 Kb] JPG [3,098.9 Kb] PDF [568.3 Kb] SVG [1,895.0 Kb] WMF [872.3 Kb]
Maximum raster dimensions: 2400 x 2400 pixels
at 300dpi
You may also like these images from the same collection:
|
| |
If you have any questions, please contact Customer Service by e-mail at support@iphotos.com weekdays from 9 am to 5 pm EST. |
|
|
|
|